We optimize marketing for
business continuity

A bar chart visually represents categorical data using bars. It's great for comparing categories, showing distribution, and easy interpretation

Donut charts, like pie charts, show different parts of data. They're helpful for comparing things easily.

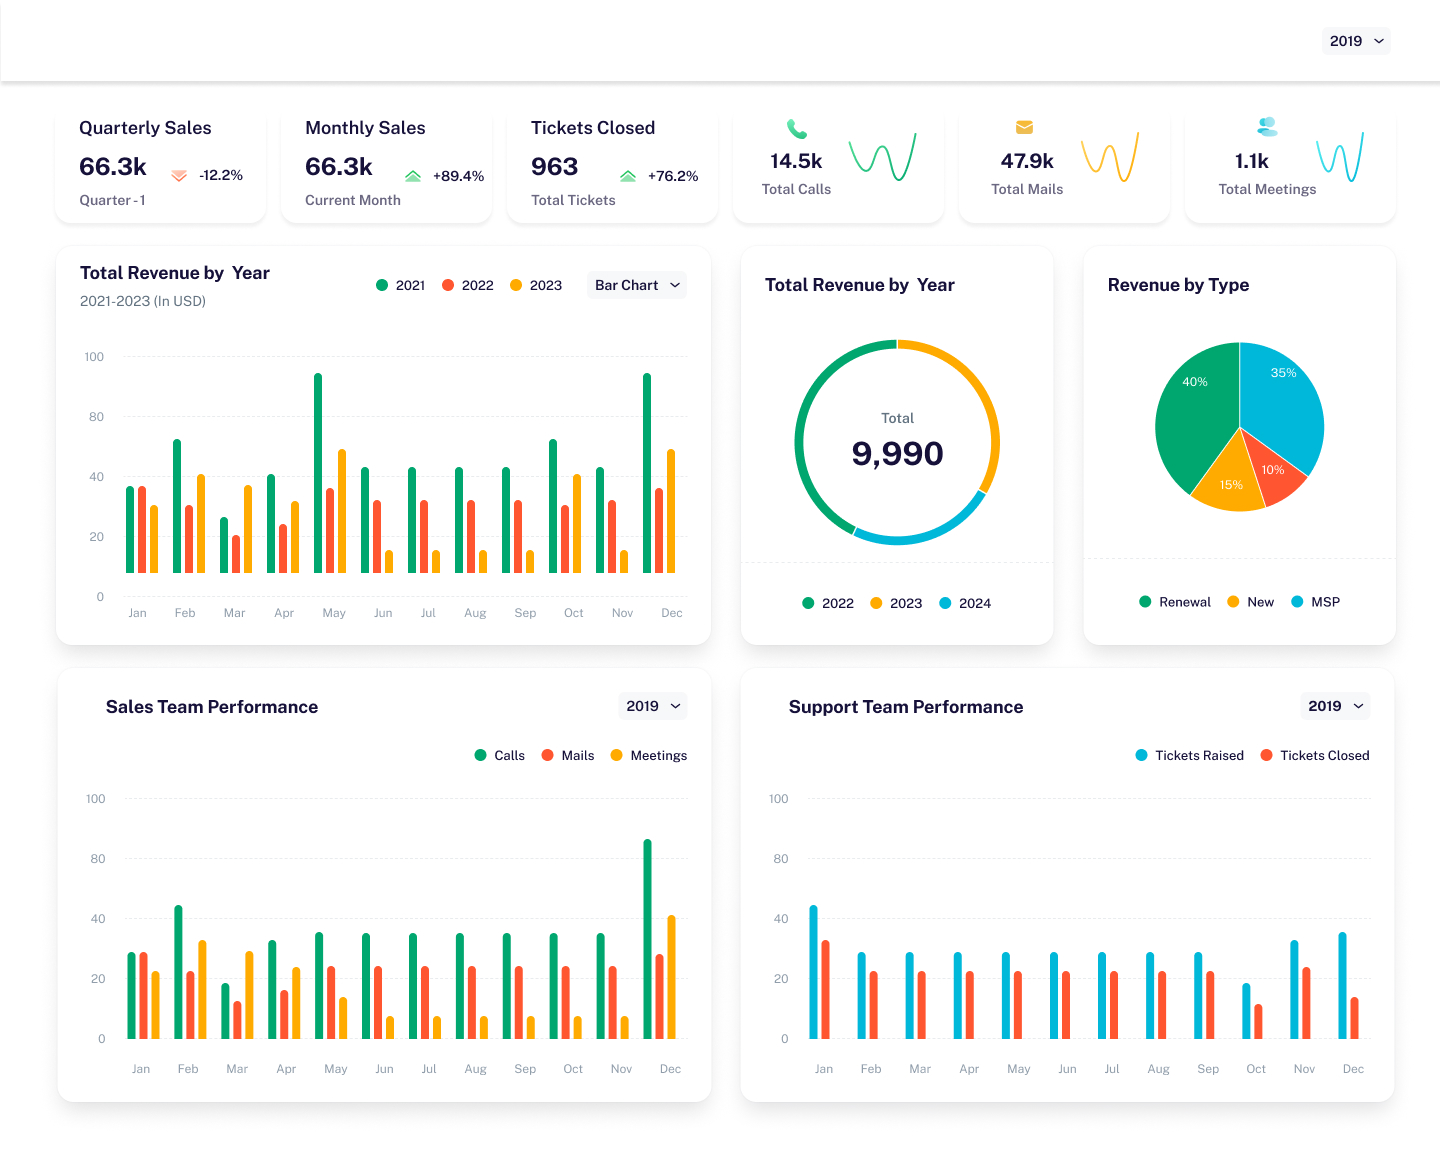
Pie charts display proportions visually, compare categories, and highlight dominant ones

In data analysis, cards display key metrics or summary information in a concise format, making it easy to grasp essential insights quickly

How It Works

Define Objectives or KPI's:

  • Clearly outline goals and objectives.
  • Identify key metrics to track.

Data Collection:

  • Gather data from various sources.
  • Ensure data accuracy and relevance.

Data Cleaning and Preparation

  • Remove inconsistencies, errors, and missing values
  • Standardize formats and structure.

Data Analysis and Modeling

  • Use statistical methods or machine learning algorithms.
  • Uncover insights and patterns

Data Integration

  • Clearly outline goals and objectives
  • Identify key metrics to track

Testing and Validation

  • Test dashboard functionality
  • Validate data visualization accuracy

Empower Your Business with
Analyfi's KPI Dashboard Software

Track Business Performance

Monitor key metrics in real-time and ensure progress towards goals with customizable dashboards.

Predict Problem

Anticipate challenges using advanced AI technology to forecast business growth and identify potential issues.

Make Informed Decisions

Leverage actionable insights to plan strategies and drive business growth with confidence.

Blogs

The Ultimate Guide to KPI Dashboard Design: Drive Insights and Empower Decisions

In today's data-driven world, businesses are bombarded with information. Key Performance Indicators (KPIs) are crucial for understanding performance and making informed decisions.

Top 10 Key Performance Indicators Every Business Should Track

In the competitive business landscape, tracking the right Key Performance Indicators (KPIs) is crucial for success. KPIs act as a compass, guiding your decisions and revealing areas for improvement.

How KPI Dashboards Can Transform Small Businesses

For small businesses, every decision carries significant weight. Resources are often limited, and efficiency is paramount. In this competitive landscape, having a clear understanding of your business performance is crucial.

Create your first KPI dashboard with analyfi

Lorem ipsum dolor sit amet, consectetur adipiscing elit. Diam ut id nisl tellus rhoncus, imperdiet